Profiling
To profile your pocketpy program, you can run main.exe with --profile flag.
For example, to profile test/test_math.py, run
main.exe --profile test/test_math.pyThis will output a JSON report file named profile_report.json in the current directory,
which records the time spent for each line. To visualize the report, please install our VSCode extension.
https://marketplace.visualstudio.com/items?itemName=pocketpy.pocketpy
The VSCode extension requires pocketpy version >= 2.1.1
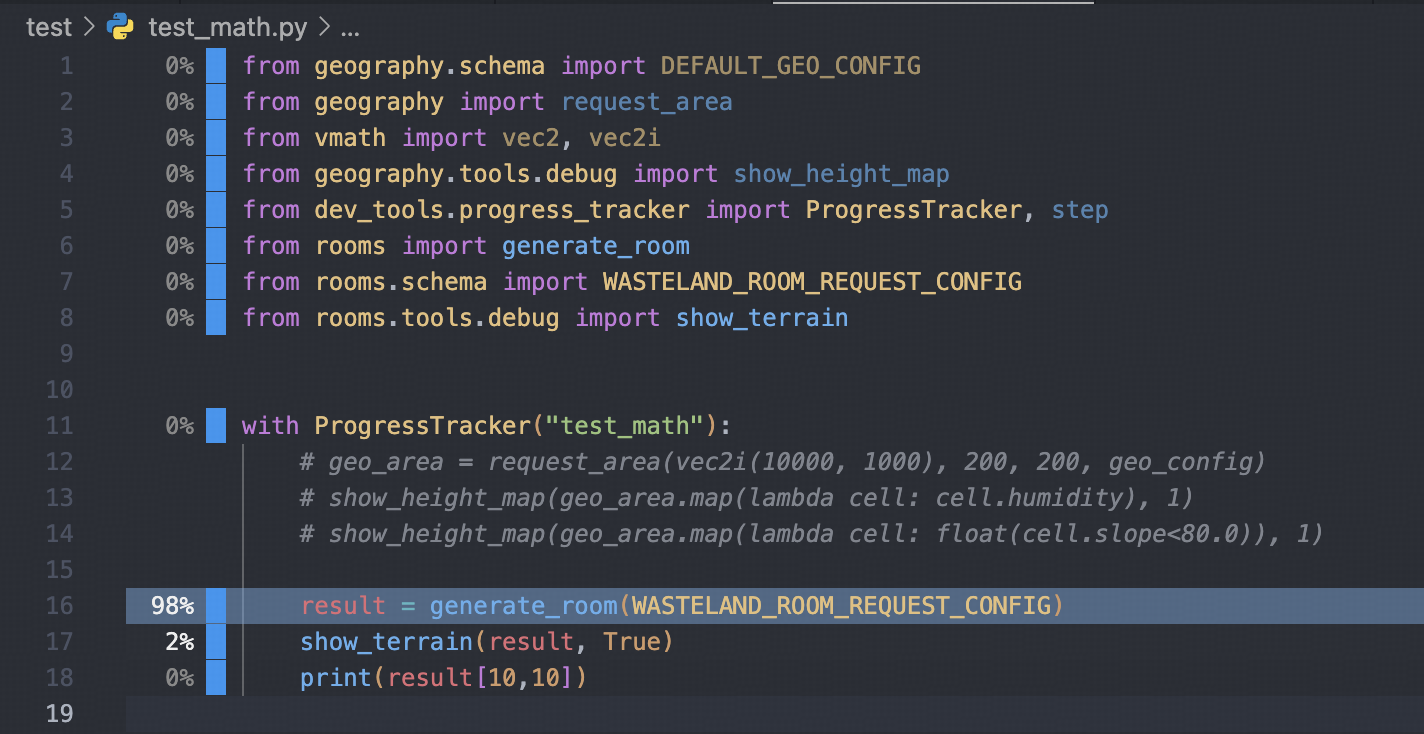
With pocketpy VSCode extension, press F1 and type pocketpy: Load Line Profiler Report,
select 1. the profile_report.json file; 2. the source root of the program. Then you will see a nice visualization of the profiling result.
Press ESC to exit the report view.